
If you are new to Power BI, the application and its scripting tools may be a bit overwhelming. This blog will provide a little overview and get you started with Power BI and how to use its scripting tools. Once a data source is added in Power BI, there are two ways of processing the data, these are Power Query and DAX.
What is Power Query
The first way to modify the data is the Power Query editor. If you click transform data in the ribbon menu, you get to the Power Query editor where you can merge, append queries, and add columns to tables. In the left pane you see an overview of all the queried tables. The main area of the screen gives a preview of the selected table containing up to 1000 rows. The right pane shows the flow of modifications to the selected table.
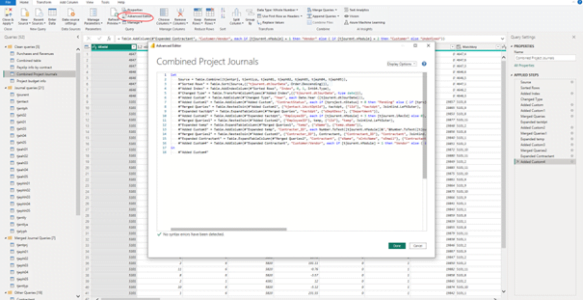
If you click “advanced editor” in the top bar, you then see the Power Query script editor for the selected table. This scripting language is also referred to as “M”

The nice thing for people with no scripting experience is that Power Query largely writes these M scripts itself when performing operations with the mouse. Using Power Query, you can create the tables that you work with in the Power BI data model. M is the language for ETL/ELT (Extract, Transform/Load) pipelines, data ingestion and wrangling. It is not only used in Power BI but also in many other data applications and cloud services by Microsoft.
What is DAX?
DAX or Data Analysis Expressions is Power BI’s language for analysing data and creating calculated columns. DAX lays somewhere between Excel’s formula structure and a scripting language. You can get to a DAX editor by adding a Quick Measure or adding a calculated column in the table overview of Microsoft Power BI. The main advantage of DAX is that you can create aggregations, measures and calculated columns using information from multiple data tables. In Power Query – M you first need to join tables when we want to add a calculated column based on information from multiple sources making data queries grow complex rather quickly.
DAX or M?
The basic rule is that you try to create clean tables in M and that calculations are written in DAX. The workflow starts in M to clean unnecessary columns from the database table and join tables that can best be analysed together. When you have a nice set of clean tables, DAX can be used to create aggregations, define relationships, hierarchies and create filters.
Of course, there are exceptions to the above. An important one is processing speed. M scripts run every time we update the data queries, while DAX scripts run every time we adjust an applicable filter. This means that for very large data sets you might be able to speed up the responsiveness of your Power BI dashboard by creating calculated columns in M. This is because M scripts only run when the data is loaded and not recalculate every time, that a slicer is changed.
You can use Microsoft learn to find out more about the M syntax: Power Query M language specification – PowerQuery M | Microsoft Learn and DAX: Data Analysis Expressions (DAX) Reference – DAX | Microsoft Learn.